Ask your data a question.
Get an answer in minutes — not a dashboard in months.
Most business questions don't need a dashboard. They need an answer. Taptic Data gets you there faster with AI that's grounded in your real schema. A complete analysis environment — not a chatbot and not a bolt-on.
Powerful enough to stand alone. Smart enough to work with your existing BI stack.
Sound familiar?
These are the problems teams hit every week. Taptic Data was built to fix them.
Every question becomes a ticket
Someone asks a simple question. It turns into a ticket. Then a meeting. Then a one-off dashboard nobody maintains. Meanwhile, the answer takes days.
Your AI-generated SQL almost works
You paste your question into ChatGPT and get plausible SQL — that references tables that don't exist. Generic AI doesn't know your schema, your joins, or your naming conventions.
Dashboard sprawl, decision drought
Your team has 40 dashboards and counting. Half are stale, most answer questions nobody is asking anymore. But every new request still defaults to "let's build a dashboard."
Why teams choose Taptic Data
AI that knows your schema
Not a chatbot — a schema-aware analysis engine. No hallucinated tables. No prompt gymnastics.
From question to verified answer in minutes
Plain English to trusted SQL, results, and charts — in a single workflow. No waiting on tickets.
Answers first, dashboards later
Answer the question in minutes. Only build a dashboard if the answer deserves one.
Full control, not a black box
See the SQL. Edit it. Ask the AI to explain it. Correct errors and refine without starting over.
Fits your stack today
No forced migration. Use Taptic for analysis upstream, keep your BI for presentation downstream.
Built for any team with a database and questions that can't wait
Stop rewriting queries because the AI didn't understand your database
Taptic Data's AI reads your real schema — your tables, columns, types, and relationships. It generates SQL that actually runs, not SQL that "almost works." This is the difference between novelty AI and production analytics.
- Schema-aware by design — knows what exists, what joins, and what's valid
- No fabricated tables. No mismatched columns. No guessing.
- Explainable — ask the AI to walk through exactly what it did and why
Does this question really need a dashboard?
Most questions have a short shelf life. Taptic Data answers them in minutes — so your team can act now instead of waiting for someone to build and maintain another dashboard.
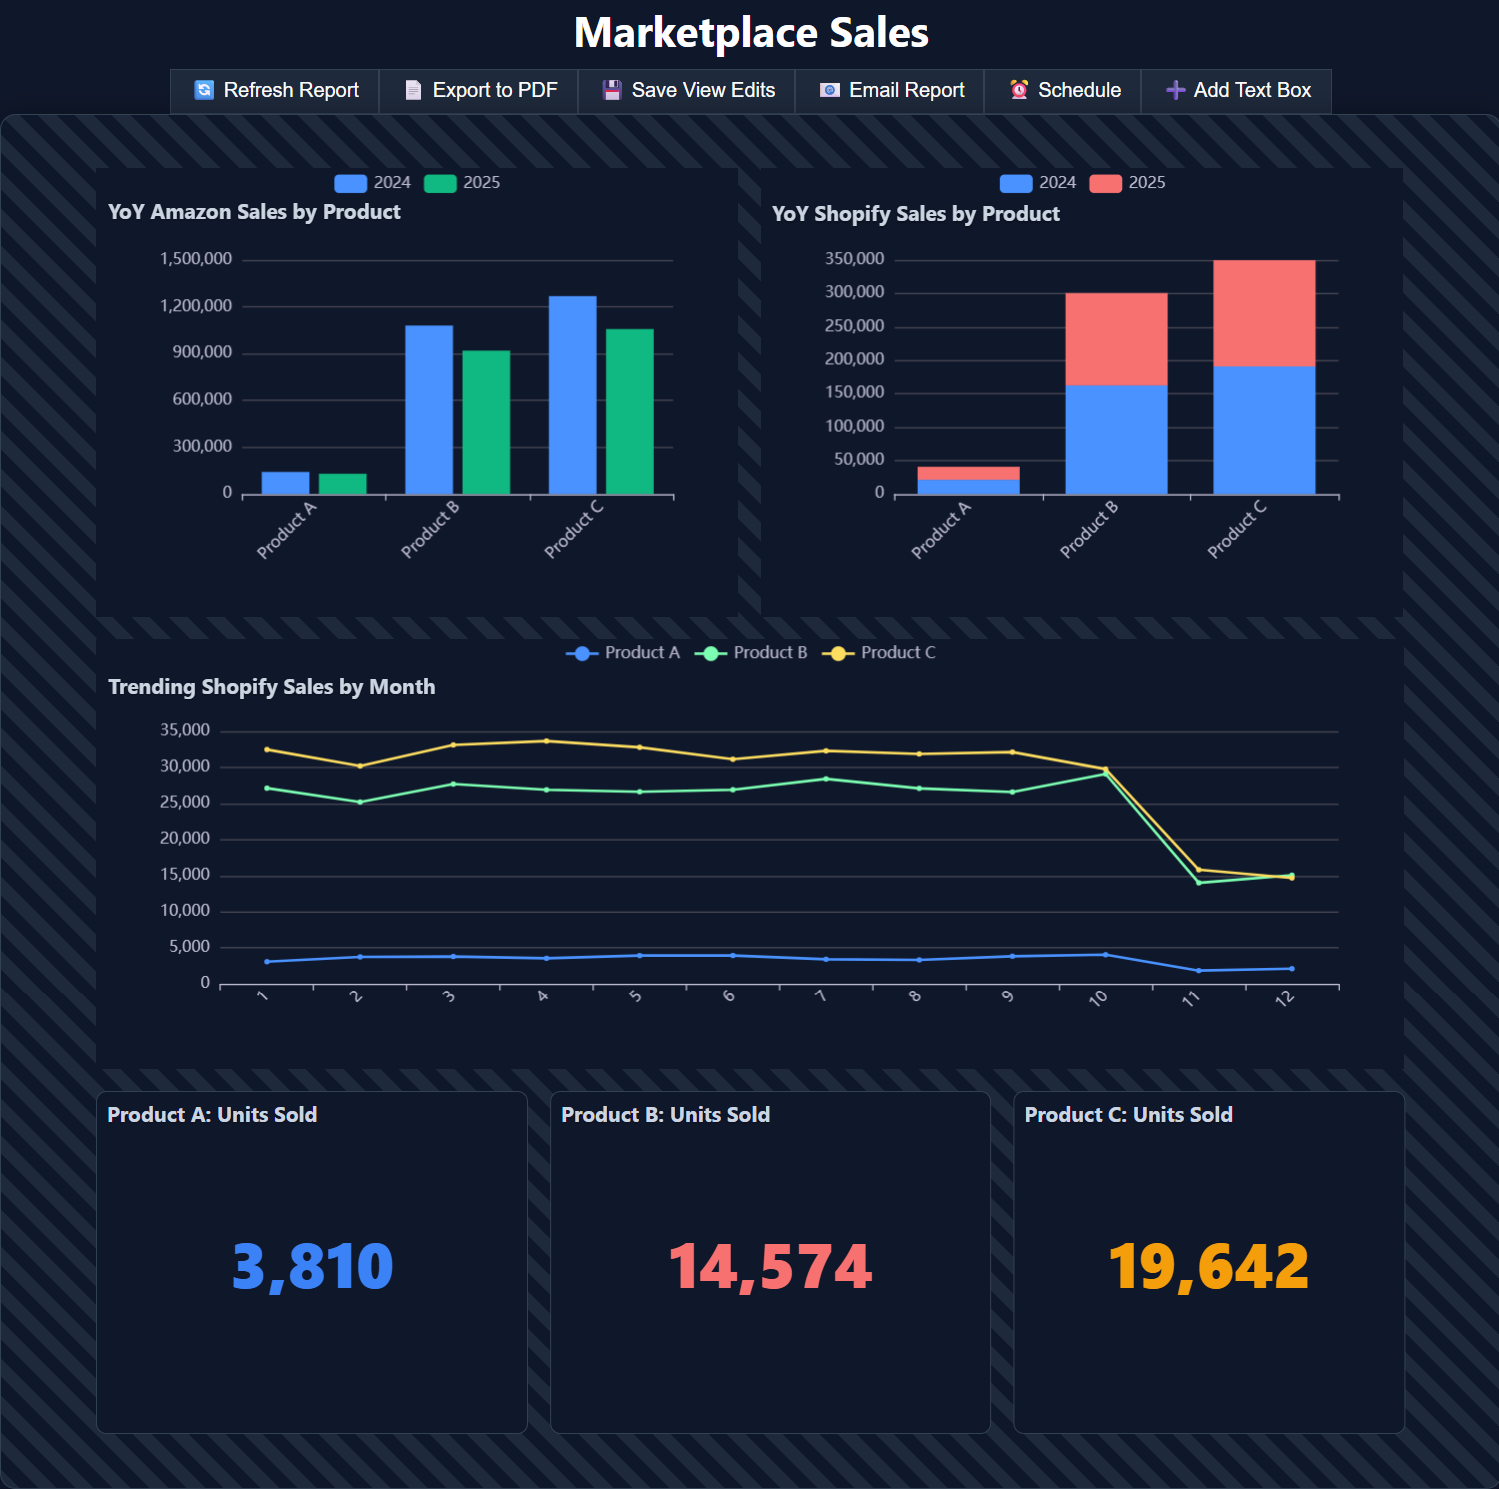
When an answer does deserve to live longer, turn it into a canvas report with charts, KPIs, and scheduled email delivery — all linked to your SQL and refreshable on demand.
- Answer now, publish only when worth maintaining
- Canvas reports — drag charts and KPIs onto a grid when the insight deserves to be shared
- Schedule and deliver — email reports to stakeholders automatically, or export to PDF
Answer first. Publish later — if needed.

Fast enough for ad-hoc questions. Precise enough for production queries.
Smart Query gives analysts a full SQL editor with AI assistance built in — not replacing your expertise, but accelerating it. Generate, refine, explain, and promote queries without ever losing control.
- AI helpers — generate from plain English, explain errors, and suggest corrections
- Edit and iterate — correct logic, refine filters, extend queries without starting over
- Promote to views — turn successful queries into reusable AI-ready views with standardized fields
Less prompt engineering. More actual analysis.
Your data, always fresh, always ready
Connect directly to your database and bring in tables, views, or saved query imports. Set refresh schedules and let Taptic keep everything current — so your AI always has the latest data to work with.
- Per-object schedules — daily, weekly, monthly, or custom refresh cadences
- UPSERT refresh — merge new and changed rows without duplicating data
- Custom connectors — have Snowflake, Shopify, or a homegrown system? Request a connector — we ship fast.
A dependable data foundation for everything that follows.

Connects to what you already use
See Taptic Data in Action
Watch a quick walkthrough of the full workflow — from question to answer to report.
Your analysts have questions.
Give them answers in minutes.
Schema-aware AI. Trusted SQL. Charts and reports when you need them. No migration required.